Outlook on Economic Recovery
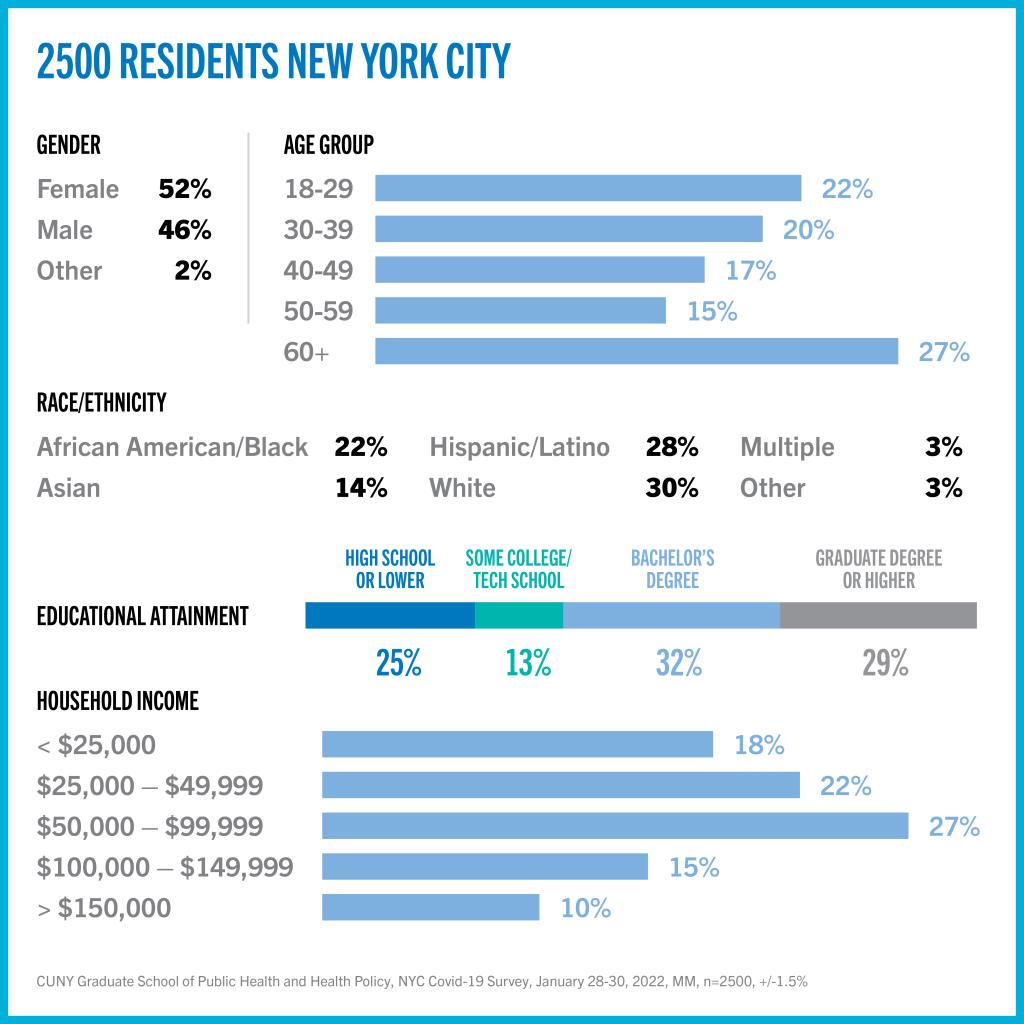
These findings are from data from a survey fielded by the CUNY Graduate School of Public Health and Health Policy from January 29-31, 2022. The survey was fielded citywide to a sample of n=2500 adults. Comparison points are drawn throughout from a survey fielded one year ago.
The Recovery:
When do New Yorkers expect the economy to fully recover from COVID?
- 32% of respondents expect the economy will recover in over a year, March 2023, while 16% were more optimistic with a September 2022 recovery and 15% expect no recovery at all
- 37% believe recovery will not occur until more New Yorkers are vaccinated
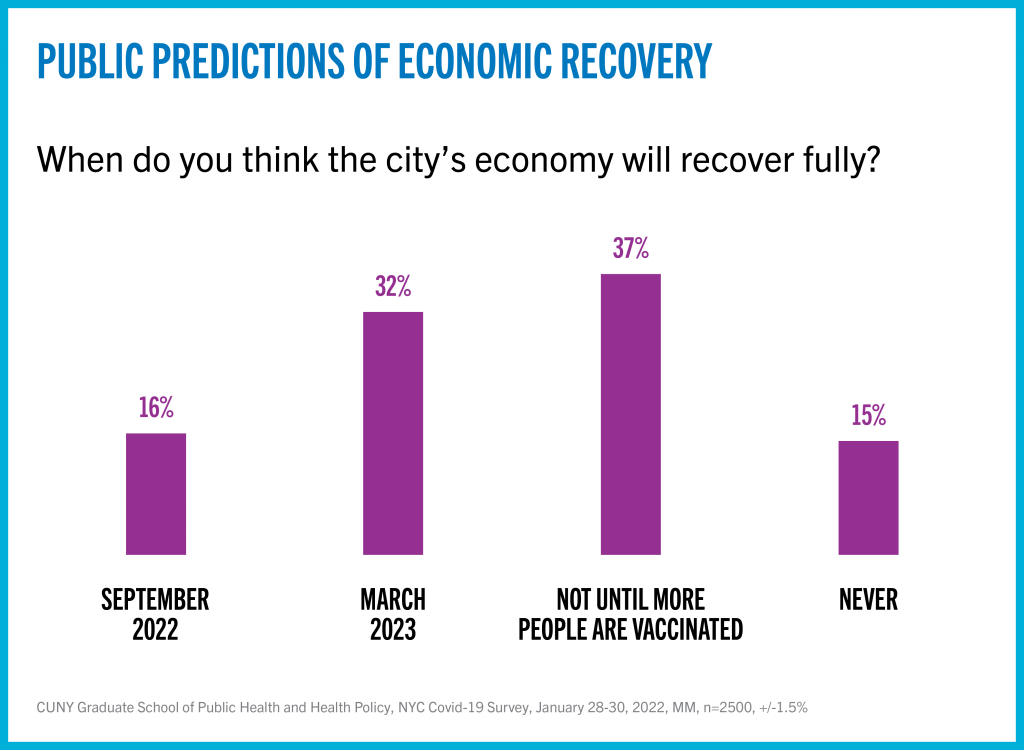
- In the Bronx, an uncertain recovery was expected to the highest degree, with 43% reporting that they don’t see the economy recovering until more people are vaccinated (as compared to 33%-37% in the other boroughs).
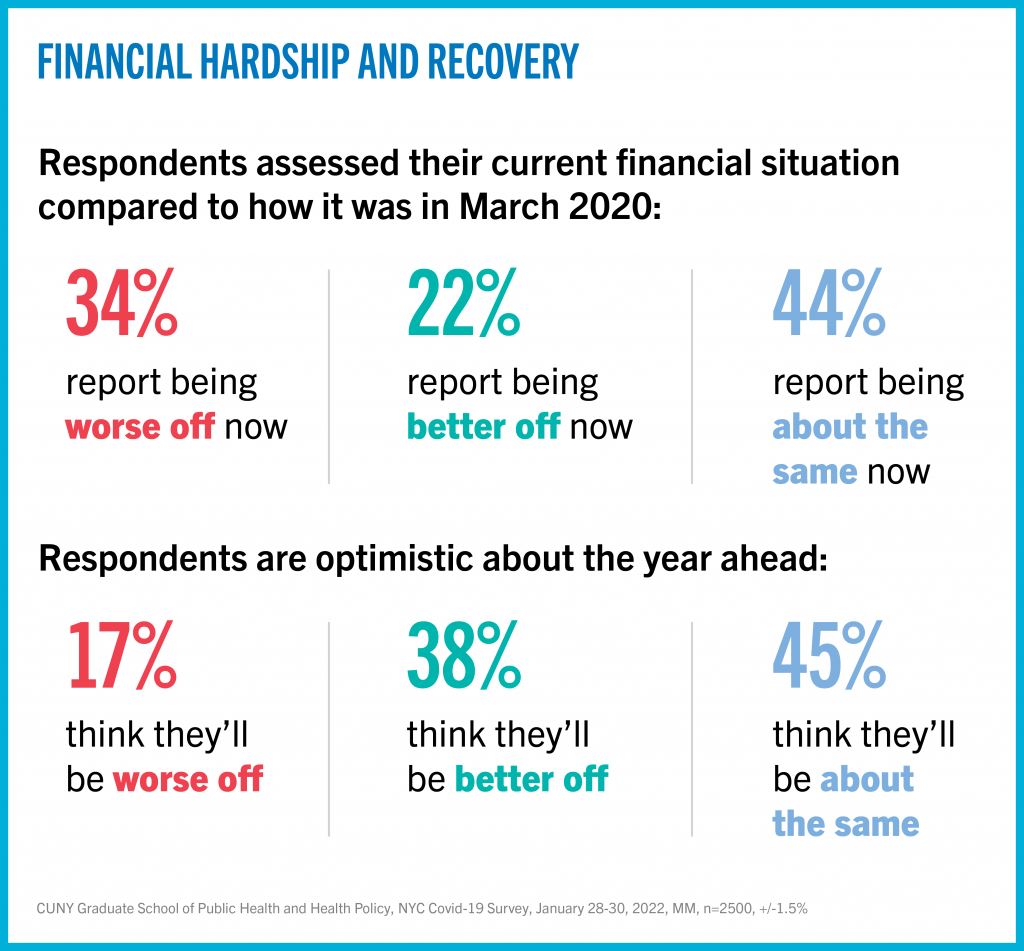
- Nearly 1 in 3 respondents (34%) reported being worse off financially today than they were in March 2020, at the start of the COVID-19 Pandemic. 22% reported being better off and 44% were about the same. However, respondents were considerably more optimistic about the year ahead with 38% believing they will be better off in a year from now. 17% think they will be worse off and 45% about the same.
What are the financial and mental health impacts?
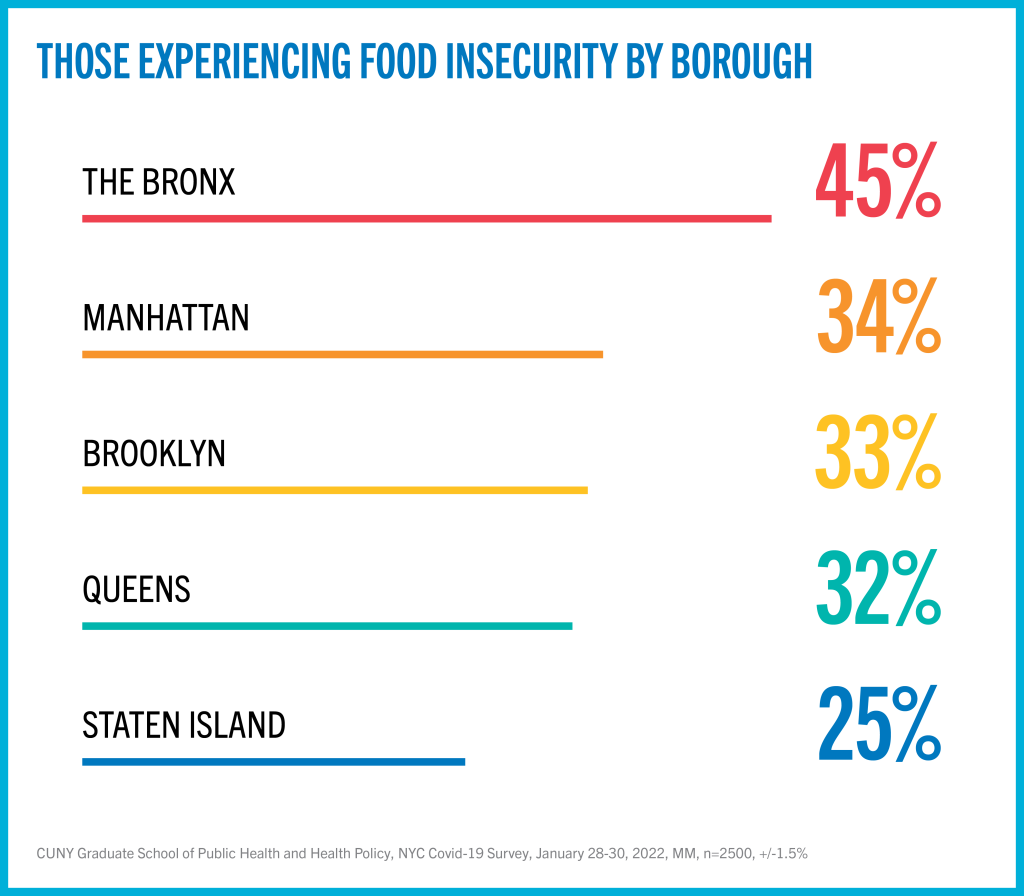
- Citywide, 34% of participants reported experiencing food insecurity. This is a 5% increase, up from 29% reported a year ago (January 2021).
- Bronx respondents:
- 43% don’t see the economy recovering until more people are vaccinated, compared with 33-37% in other boroughs.
- 45% report experiencing food insecurity in the past month. The lowest was in Staten Island (25%) with Queens, Brooklyn, and Manhattan at 32%, 33% and 34%.
- A majority (58%) of all respondents reported rarely or not at all feeling down, depressed, or hopeless in the last two weeks. 24% reported feeling this way several times, 9% said more than half the time while another 9% report feeling down nearly every day.
- These statistics can be explained by a persistence of depression among our respondents which continues to be around 18% comparable to a year ago.
- Citywide, Latino/a participants reported the most food insecurity at 48%, as well as the highest rates of depression (23%).
Respondents’ trust in the government’s response to the pandemic
- Asked which they trust the most, a plurality of respondents (32%) reported trusting the pandemic response from both the State and Federal Government in the U.S.
- 20% trust only the federal response and 10% trust only the state response
- 25% said they trust neither the federal or state government responses while 14% were unsure.
Who trusts the government the least?
- 25% of respondents reported they do not trust the state, nor the federal government. Those respondents were most likely to be White (33%) or Latino/a (30%), between the ages of 18-29 years old (27%) and have an annual household income of $50, 000-$99,000 (28%).
Vaccines Rates and Requirements
These findings are from data from a survey fielded by the CUNY Graduate School of Public Health and Health Policy from January 29-31, 2022. The survey was fielded citywide to a sample of n=2500 adults. Comparison points are drawn throughout from a survey fielded one year ago.
Who’s vaccinated and boosted?
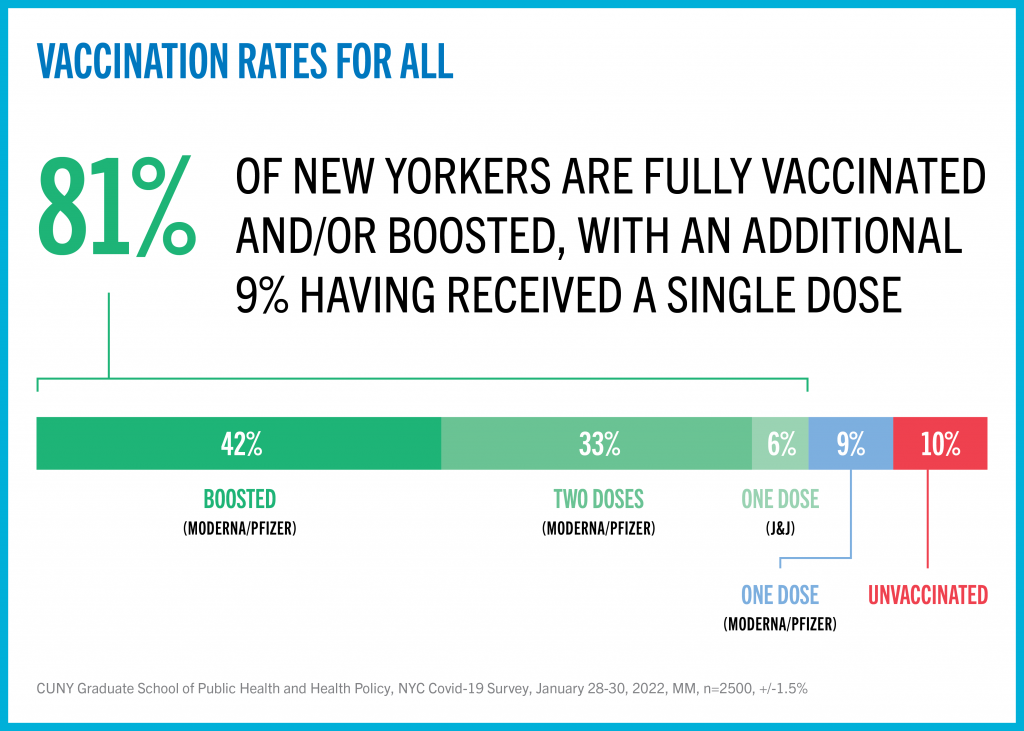
- Nine percent (9%) of participants were vaccinated with one dose, 39% were fully vaccinated with either two doses of Moderna or Pfizer vaccines or one dose of the Johnson & Johnson vaccine, and an additional 42% had received a booster
- Vaccination rates varied slightly by borough, but booster uptake displayed the greatest discrepancy in the Bronx – Brooklyn, Queens, Staten Island, and Manhattan had booster rates from 42-49% while participants in the Bronx reported 28% booster uptake
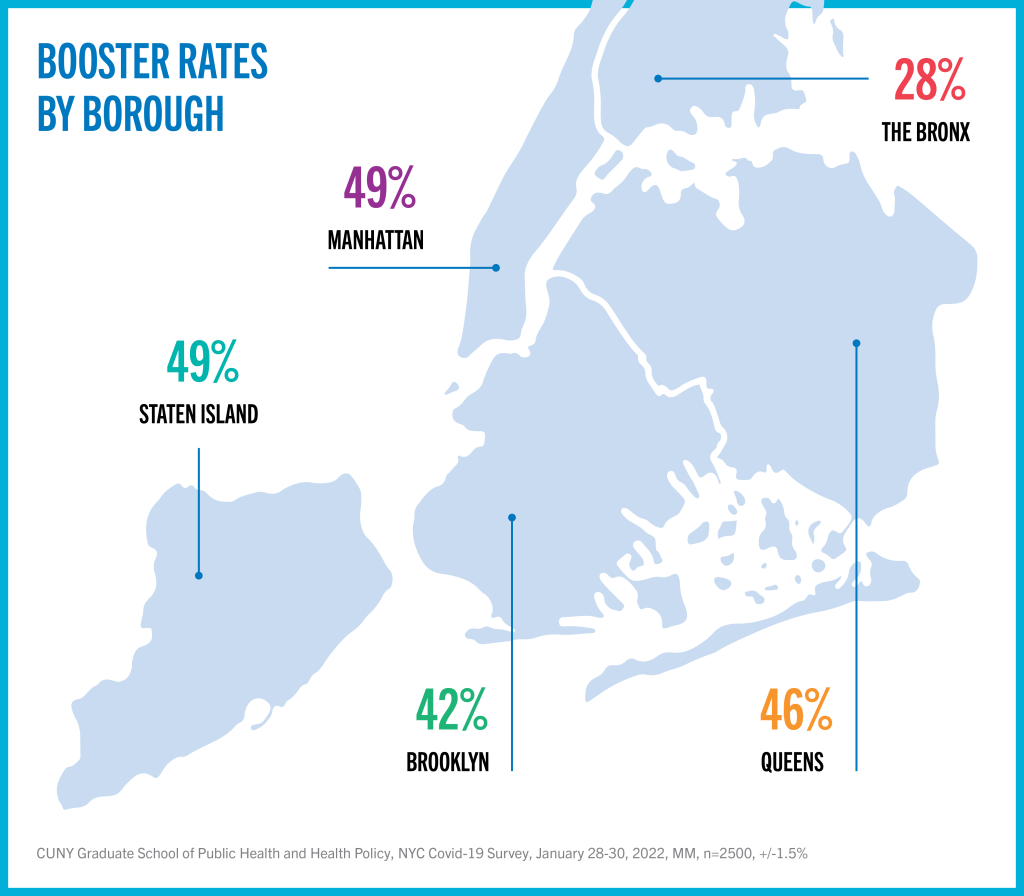
- Among race and ethnic groups, White participants were most likely to be boosted (58%), while Latino/a participants had the lowest rates of booster uptake (30%).
- 38% of partially or fully vaccinated respondents said that the omicron outbreak influenced their choice to receive their first vaccine shot, and 57% of boosted respondents said the omicron outbreak motivated them to get the booster.
How is news of a COVID medication affecting vaccination or booster rates?
- The availability of a medication to treat symptoms of COVID-19 does not deter 55% of people from getting the vaccine or booster in the future.
- 24% said they were unsure while 22% report the medication will motivate them to opt out of getting a vaccine/booster.
- The respondents who seemed most swayed by the availability of a medication were those who have received only one dose of the Moderna or Pfizer vaccine to date, with 48% saying they are less likely to take the vaccine or a booster. Among unvaccinated respondents, only 18% said the same.
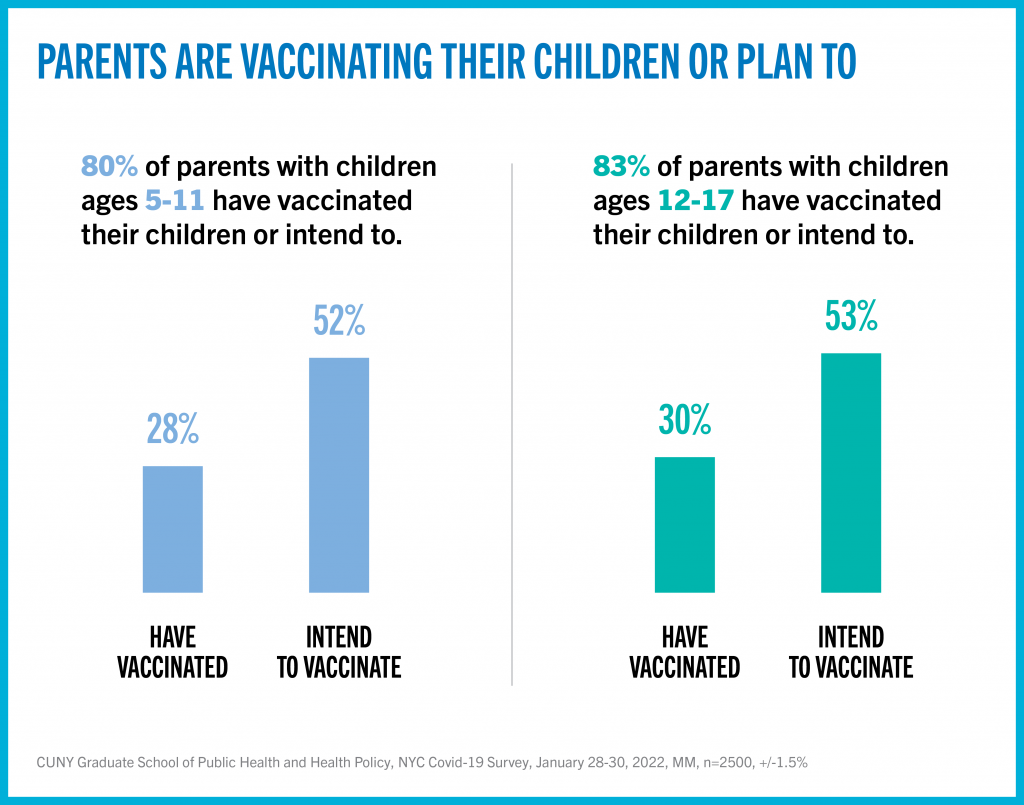
What are parents deciding?
- Parents reported similar vaccination behaviors between child age groups with 52% of parents with 5-11 year olds very, or somewhat likely to vaccinate their child, 20% said they were not very or not at all likely, with 28% already vaccinated.
- 53% of parents of 12-17s indicated that they plan to vaccinate their child, 17% said they were not very or not at all likely, with 30% reporting their child is already vaccinated.
How do New Yorkers feel about vaccine requirements?
We asked participants their views of whether unvaccinated adults should face restrictions.
- 54% of respondents said they are feeling angry with unvaccinated adults. This anger is highest among residents of Manhattan (65%) and lowest in the Bronx (43%).
- Respondents were split (51% agree/ 49% disagree) with having unvaccinated adults pay higher health insurance premiums.
- However, a super majority (2/3rds or more) agree with all other restrictions presented: 69% think unvaccinated adults should not be allowed to participate in indoor activities such as dining, movie theaters and gyms; 68% believe that unvaccinated adults should not be allowed to travel on airplanes. (Infographic on restrictions)
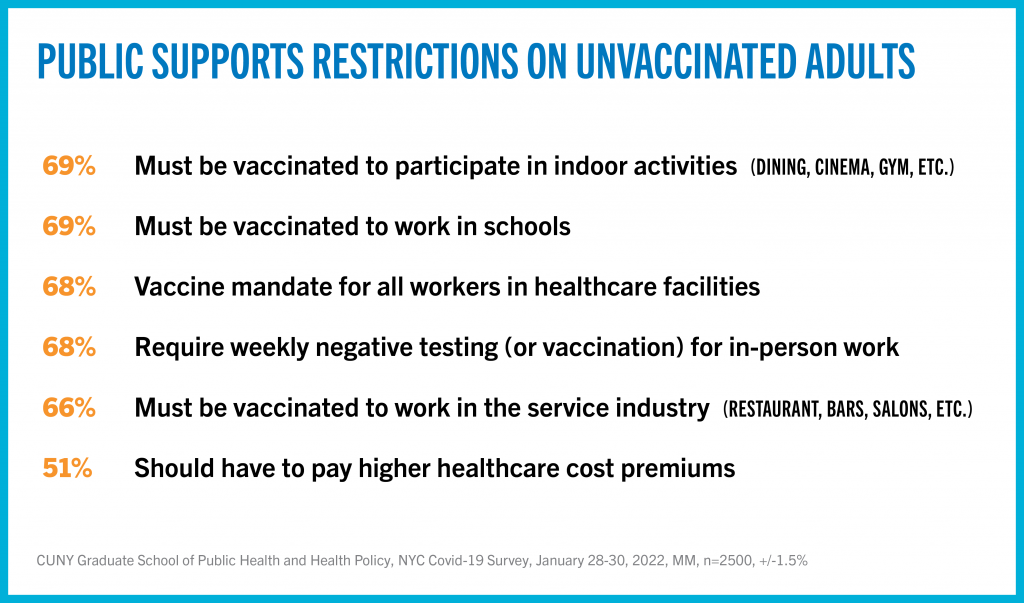
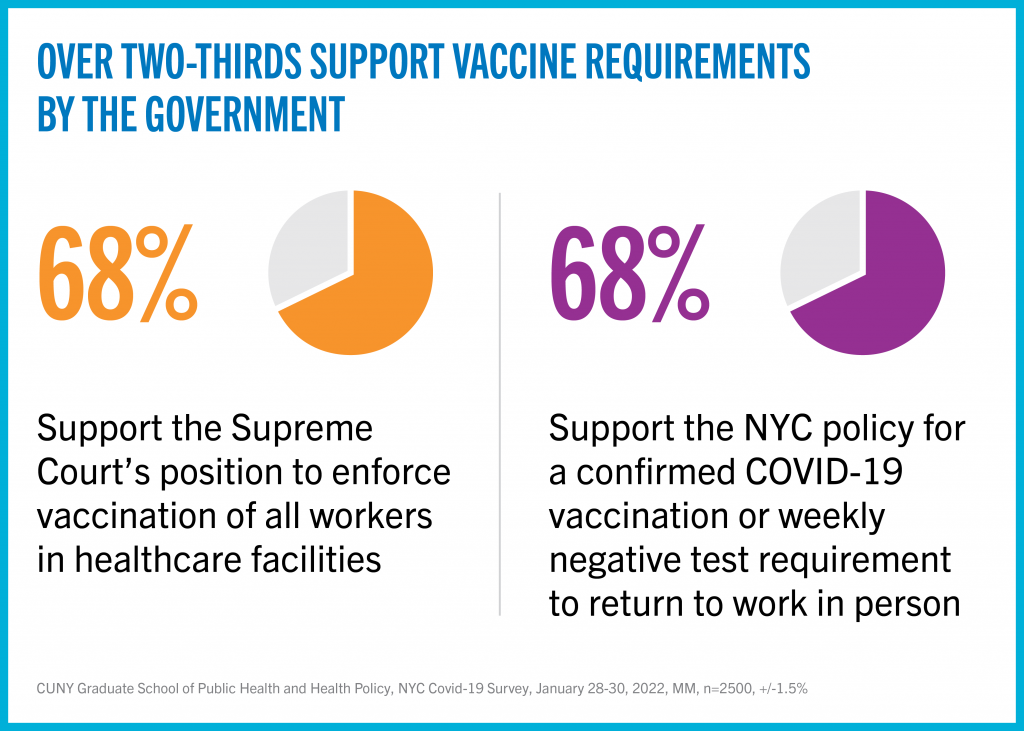
- More than two thirds of respondents (68%) support the Supreme Court’s position to enforce vaccination of all workers in a healthcare facility.
- A similar percentage (66%) believe that unvaccinated adults should not be allowed to work in the service industry (i.e., restaurants, bars, hair salons, hospitality, etc.) and 69% believe the same for work in schools.
- Only 45% believe additional restrictions on unvaccinated adults will motivate them to get the COVID-19 vaccine while 29% were not sure and 26% thought it would not make a difference.
In the service industry question, there was slight variation by education and income level:
Agree that you should be vaccinated to work in the service industry
62% of highschool degree or less
63% some college or technical school
67% Bachelor’s degree
70% Graduate degree or higher
Agree that you should be vaccinated to work in schools
67% of highschool degree or less
65% some college or technical school
70% Bachelor’s degree
72% Graduate degree or higher
Agree that you should be vaccinated to work in the service industry
62% Less than $25,000
68% $25k-$49k
66% $50k-99k
65% $100k-$149k
69% More than $150k
Agree that you should be vaccinated to work in schools
66% Less than $25,000
70% $25k-$49k
71% $50k-99k
68% $100k-$149k
70% More than $150k
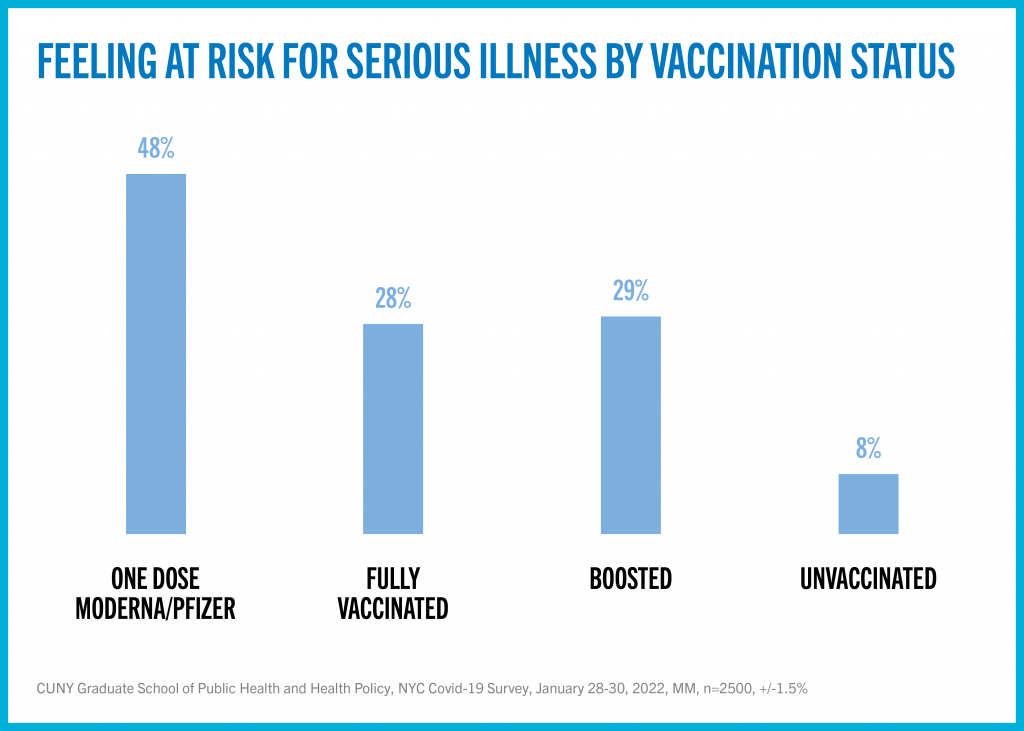
Do New Yorkers feel at risk?
Overall, 28% of respondents said they currently feel at risk for serious illness related to COVID-19. Risk perception varied significantly by vaccination status, with unvaccinated respondents feeling the least at risk for serious illness:
COVID-19 Testing Use and Distribution
These findings are from data from a survey fielded by the CUNY Graduate School of Public Health and Health Policy from January 29-31, 2022. The survey was fielded citywide to a sample of n=2500 adults. Comparison points are drawn throughout from a survey fielded one year ago.
Are respondents using free home COVID-19 test kits?
- Nearly half of all respondents (55%) reported they had applied for a free home COVID-19 testing kit distributed by the federal government.
- Use of the federal website was highest among participants in Manhattan (64%); then Staten Island (56%), Queens (56%), Brooklyn (51%) and the Bronx (48%).
COVIDtests.gov use by Race/Ethnicity:
White 61%
Asian 53%
Latino/a 53%
Black 48%
COVIDtests.gov use by educational attainment:
High school degree or less 43%
Some college or technical school 49%
Bachelor’s degree 58%
Graduate degree or higher 64%
COVIDtests.gov by income:
Less than $25,000 40%
$25k-$49k 48%
$50k-99k 60%
$100k-$149k 70%
More than $150k 63%
- Use of the government’s test ordering system was highest among participants who have received a vaccine booster (66%) and lowest among those that remain unvaccinated (32%). This is an indication of the vigilance of vaccinated individuals in containing the spread of the virus.
- Similarly, unvaccinated respondents were most likely to report not needing a testing kit at home (32%).
Why respondents want home test kits
- Among all respondents, the top three reasons for wanting a home test available were to test if they had symptoms (30%), to have a home kit available in case they needed it (25%), to test before getting together with friends or family (18%). 6% said they needed the tests for work, and another 6% said they needed to show a test for travel. 16% of respondents said they don’t need a test.
- Respondents expressed their preference for home testing because of the convenience (38%) and 29% because of the long lines to get tested outside of the home. Long lines were the biggest concern in Staten Island (40%), whereas convenience ruled out in the other four boroughs (41%-50%).
Testing during the omicron outbreak
- Since December 1 of the omicron outbreak, 21% of respondents reported testing positive for COVID-19.
- A majority reported use of a PCR test (60%). Only 28% reported a positive home test.
- Those who reported testing positive were most likely to be in younger age groups (27% among 18-39 year olds) as compared to older age groups (20% among 40-59 years; and 12% in 60 years and above).
- By race and ethnicity Latino/a respondents reported testing positive the most (26%). This could be attributed to a higher percentage working as frontline workers in various services leading to testing more often and in circumstances that lead to exposure risk.
- Testing and positive results were similar across the various boroughs : Manhattan (23%); the Bronx (22%); Queens (21%); Brooklyn (19%); Staten Island (18%)
Do New Yorkers support vaccine and testing policies to protect workers going back to work?
- Over two thirds (68%) of respondents support the New York City policy for requiring a confirmed vaccine or weekly COVID-19 negative test results to return to work in person.
- Less than half (46%) agree that weekly negative testing can be an acceptable alternative to vaccination for any situation requiring proof of vaccination.
How often respondents wear a mask in public
- A super majority (72%) say they always wear a mask in public with another 19% saying they wear them most of the time. 6% wear them some of the time of the time and 3% said never wear them.
- Masking was by far the highest among participants in the Bronx (79%); then in Queens (72%); Brooklyn and Staten Island (69%).
- Masking rates have dropped as compared to one year ago. In January 2021, 80% of respondents reported they were always masking in public, whereas in January 2022, 72% said the same.
Survey methodology
The CUNY Graduate School of Public Health & Health Policy (CUNY SPH) survey was conducted by Consensus Strategies from January 28-30, 2022. The sample for the NYC results was n=2,500, with a Credibility Interval (CI) similar to a poll’s margin of error (MOE) of +/- 1.5 percentage points. The data sets were weighted by gender, age, ethnicity, education and borough based on the 2020 1-year American Community Survey model. It is important to remember that subsets based on gender, age, ethnicity and region carry with them higher margins of error, as the sample size is reduced. Data was collected using an Interactive Voice Response (IVR) system of landlines (n=1118), SMS-to-online (n=589) and an online panel provided by Consensus Strategies (n=793).