Study Overview
The CUNY Graduate School of Public Health and Health Policy (CUNY SPH) cross-sectional survey was conducted by Emerson College Polling in weekly, biweekly, and then monthly intervals beginning in mid-March 2020 to track the social, economic, health, and mental health impacts of COVID-19 from the initial onset of COVID-19 epidemic in New York City. This effort started March 13-15 (week 1), and continued with questions fielded March 20-22 (week 2) and March 27-29 (week 3), April 3-5 (week 4), April 10-12 (week 5), April 17-19 (week 6), April 24-26 (week 7), May 1-3 (week 8), May 15-17 (week 10), May 29-31 (week 12) and June 26-28 (week 16).
Sampling
A total universe of New York State was defined based on zip codes and congressional districts (1-27) of which 19,542,209 adults (age 18+) were the target population. Three regions, made up of 27 congressional districts were included (2,865,489 in region 1; 8,857,639 in region 2; 7,819,081 in region 3) and defined as follows:
- Region 1: Long Island 14.7% (USC1-4), Shirley, Seaford, Glen Cove, Garden City
- Region 2: NYC 45.3% (USC 5-16) Queens, Brooklyn, Manhattan, Staten Island, Bronx
- Region 3: Upstate 40% (USC 17-27): Albany, Harrison, Carmel, Rhinebeck, Amsterdam, Schuylerville, Utica, Corning, Irondequoit, Buffalo, Rochester
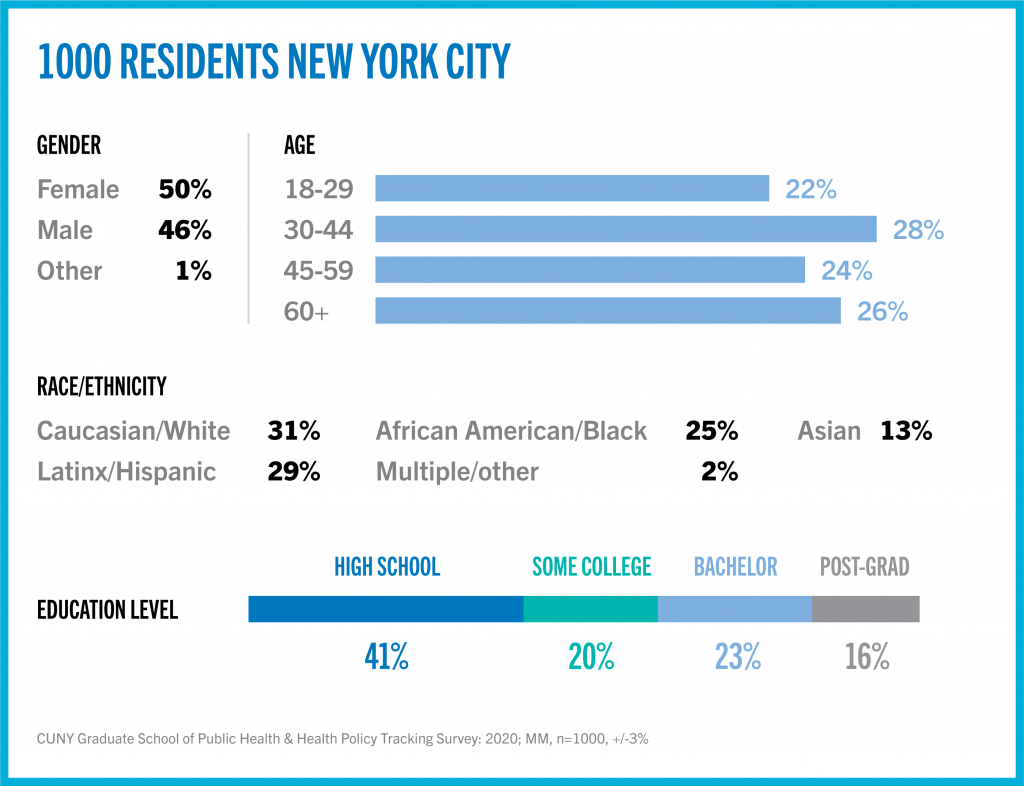
For the New York City subset analysis, a total universe of 8,857,639 NYC residents was similarly defined of which an estimated in 7,086,111 adults were the target population. The sample for the NY Statewide and New York City results were both, n=1,000 with a Credibility Interval (CI) similar to a typical opinion poll’s margin of error (MOE) of +/- 3 percentage points. New York City data collection used this oversample (n=1,000) for purposes of additional sub-group analysis and was proportionally 45.3 percent of the total statewide sample.
A blended surveying method utilizing landline, mobile texting and online platforms was used to create the sample and correct for lack of internet access in some households. About two-thirds of the sample was supplied by Aristotle, Inc. which was responsible for collecting the phone-based surveys. This database has access to 14,594,355 individual consumers in New York state over the age of 18. Each survey included a random sample of approximately 28,000 landlines drawn from a database of 4,061,459 landlines and collected via an Interactive Voice Response (IVR) automated telephone system; approximately 10,000 cell phones are selected from a database of 5,140,850 mobile numbers and collected via an SMS-online text. In the NYC subset, the Aristotle, Inc. database includes 5,895,635 consumers over the age of 18; each survey then included a random sample of approximately 18,000 landlines drawn from a database of 1,590,402 landlines and collected via an IVR automated telephone system; approximately 15,000 cell phones are selected from a database of 1,981,345 mobile numbers and collected via an SMS-online text. The online component included panels provided by Dynata, Survey Monkey and Amazon Mechanical Turk (MTurk). Each survey was administered both online and via telephone in both English and Spanish. A minimum of 75 survey responders were drawn for each category of age, gender, education, and ethnicity for each survey.
The following table lists the weekly participation frequencies for each mode of survey collection.
| Survey Collection Mode and Frequency | ||||||
| Week # | Landline | Mobile | Online | |||
| NY | NYC | NY | NYC | NY | NYC | |
| Week 1 | 594 | 444 | 246 | 324 | 160 | 232 |
| Week 2 | 524 | 508 | 304 | 316 | 172 | 176 |
| Week 3 | 568 | 600 | 227 | 225 | 205 | 175 |
| Week 4 | 556 | 557 | 291 | 301 | 153 | 143 |
| Week 5 | 502 | 480 | 287 | 313 | 211 | 207 |
| Week 6 | 513 | 495 | 261 | 263 | 225 | 242 |
| Week 7 | 511 | 478 | 240 | 268 | 249 | 254 |
| Week 8 | 472 | 497 | 292 | 272 | 237 | 232 |
| Week 10 | 469 | 475 | 319 | 327 | 212 | 197 |
| Week 12 | 478 | 463 | 275 | 289 | 246 | 248 |
| Week 16 | 404 | 403 | 329 | 332 | 267 | 264 |
Response and Cooperation Rates
The following response and cooperation rates are based on industry standard formulas provided by the American Association for Public Opinion Research. The table below reflects the response rates for the New York City subset.
| Week # | Online response Rate* | Landline cooperation rate** | Landline Response rate | SMS Mobile response rate | SMS Mobile cooperation rate |
| 1 | 91.90% | 45.80% | 3.40% | 1.20% | 31.00% |
| 2 | 92.50% | 45.60% | 3% | 0.80% | 31.00% |
| 3 | 93.50% | 52.50% | 2.70% | 0.40% | 34.00% |
| 4 | 93.00% | 44.40% | 2.60% | 0.50% | 31.00% |
| 5 | 94.00% | 51.70% | 3.20% | 0.70% | 34.00% |
| 6 | 92.00% | 49.90% | 3% | 0.50% | 33.30% |
| 7 | 94.00% | 47.20% | 2.90% | 0.50% | 33.30% |
| 8 | 94.00% | 46.20% | 2.30% | 0.40% | 32.10% |
| 10 | 94.00% | 41.10% | 1.80% | 0.40% | 31.60% |
| 12 | 93.00% | 45.30% | 1.90% | 0.40% | 29.20% |
| 16 | 92.00% | 34.10% | 2.10% | 0.50% | 31.20% |
| Average Rate | 93.1% | 45.8% | 2.6% | 32.0% | 0.6% |
| n = (min-max) | 143-264 | 403-600 | 225-332 | ||
*Response rate is defined as the number of all eligible sample units that take a survey
**Cooperation rate indicates how many of those contacted to participate agree to take the survey[i]
Weights
Minimum thresholds (n=75) were required for each category within the variables of age, gender, education and ethnicity. Weights were applied to these four variables based on 2018 1-year American Community Survey model.[ii] Additional considerations beyond the ACS model influenced weights: currently, the Census Bureau collects race/ethnicity data by grouping Hispanics and races together (e.g. Hispanic Whites) as well as separating non-Hispanic and Hispanic groups. This means that there are two sets of Census data on race/ethnicity. Considering the racial diversity of New York City, the survey team felt that the ACS model underestimates the Hispanic (which we grouped with Latinx) population. The weights were adjusted to reflect this in Week 4 and all data from weeks 1-3 were revised to be consistent with 31% Caucasian/White, 29% Latin/Hispanic, 25% African American/Black, 13% Asian, and 2% Multiple/Other. It is important to remember that subsets based on gender, age, ethnicity, and region carry with them higher margins of error, as the sample size is reduced.
[i] Lavrakas PJ. Encyclopedia of Survey Research Methods. SAGE Publications; 2008.
[ii] Census – Table Results. Accessed July 20, 2020. https://data.census.gov/cedsci/table?d=ACS%205-Year%20Estimates%20Data%20Profiles&table=DP05&tid=ACSDP5Y2018.DP05&g=0400000US36_1600000US3651000