Data on food systems are often incomplete, siloed in different organizations, and not available at levels necessary to identify racial, ethnic or spatial disparities.
Through a planning grant funded by the National Science Foundation’s Smart and Connected Communities program, a research team from the CUNY Urban Food Policy Institute led by CUNY SPH Associate Professor Nevin Cohen, Policy Director Rositsa Ilieva, and PhD student Yvette Ng have developed a prototype dashboard (Food Environment Equity Dashboard for New York City, FEED-NYC) to begin addressing this issue.
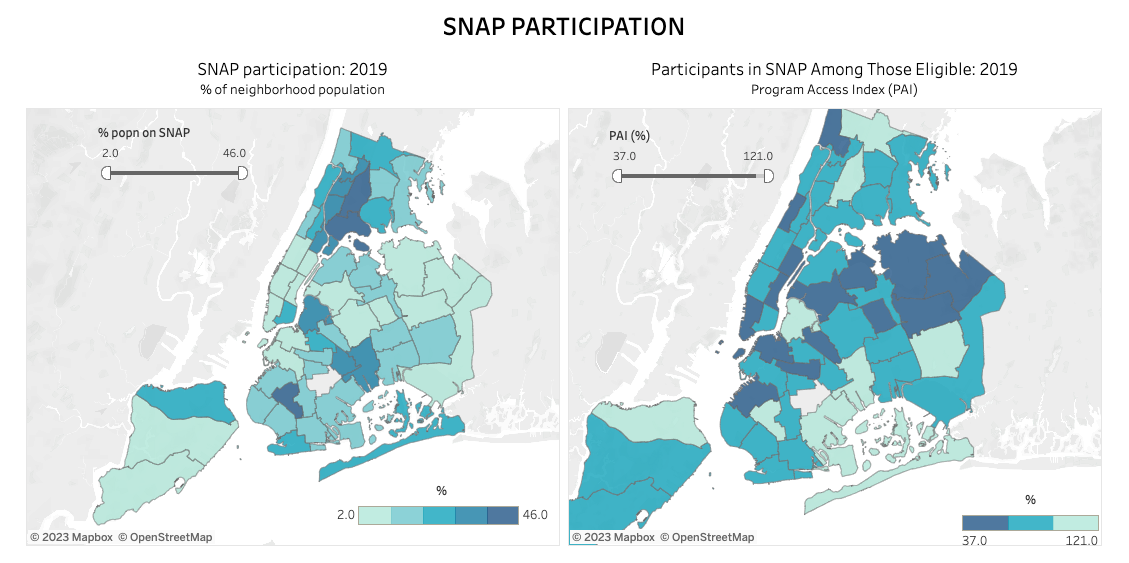
The dashboard visualizes indicators explaining different aspects of food insecurity, focusing on SNAP and school food participation, access to emergency food and neighborhood food affordability.
The project team, which, in addition to researchers from the CUNY Urban Food Policy Institute, includes representatives from community-based organizations, city agencies and other academic institutions, selected these indicators through a collaborative process and several workshop sessions at the project start and during the prototype development. By combining public data (e.g., from the US Census and NYC Open Data), statistics collected from organizations and agencies and novel sources such as mobile device location data and Google reviews, the team revealed unique insights about the NYC food environment that advocates, service providers and government officials can use to explore the root causes of food insecurity and potential policy solutions. As part of the dashboard development process, the project engaged stakeholders in discussing how to make food systems data more visible, understandable and consistent across geographies and over time.
“The prototype dashboard shows how food data can be organized and visualized to provide policy-relevant insights to advance health equity,” Dr. Ilieva notes.
Ms. Ng explained that the long-term goal is “to build a shared knowledge platform for non-profits, activists, city officials, and researchers working for food justice.”
“As a proof of concept, we welcome feedback on the prototype dashboard,” says Dr. Cohen. “We are now working on a proposal for a multi-year project that will include additional stakeholders and make accessible a much wider set of indicators.”